Exploring the role of green hydrogen for distributed energy access planning towards net-zero emissions in Nigeria

Nigeria’s power system still relies heavily on captive diesel and petrol generators, with sizeable suppressed and unmet demand. The study by Shari et al. takes this reality as the starting point and uses the Open Energy Modelling Framework (oemof) to ask a question: given Nigeria’s 2060 net-zero target, how and where does green hydrogen make sense once you optimise the system transparently?
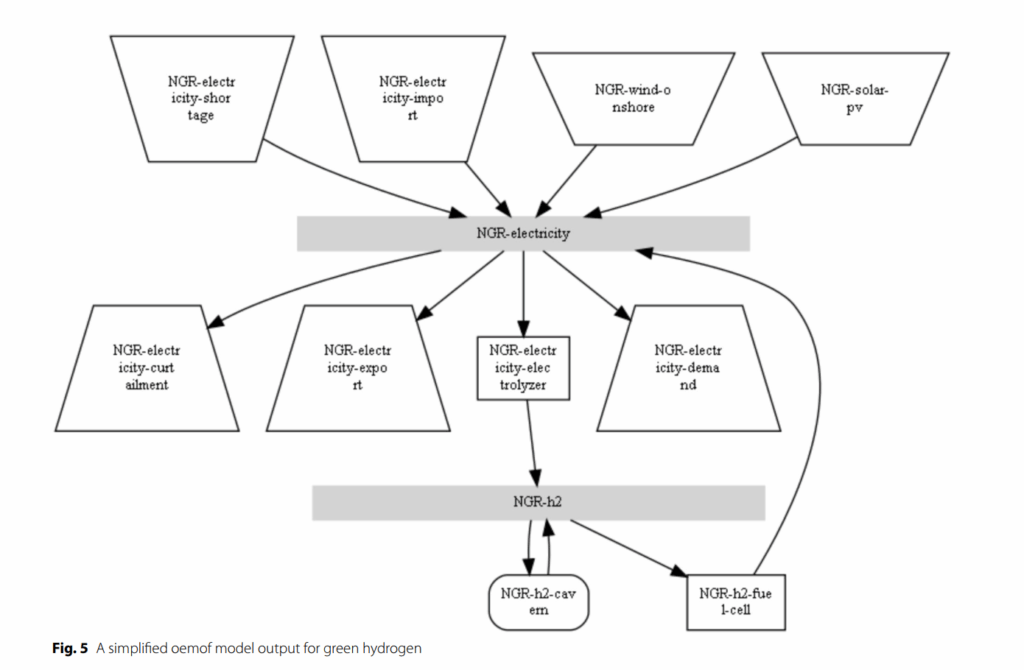
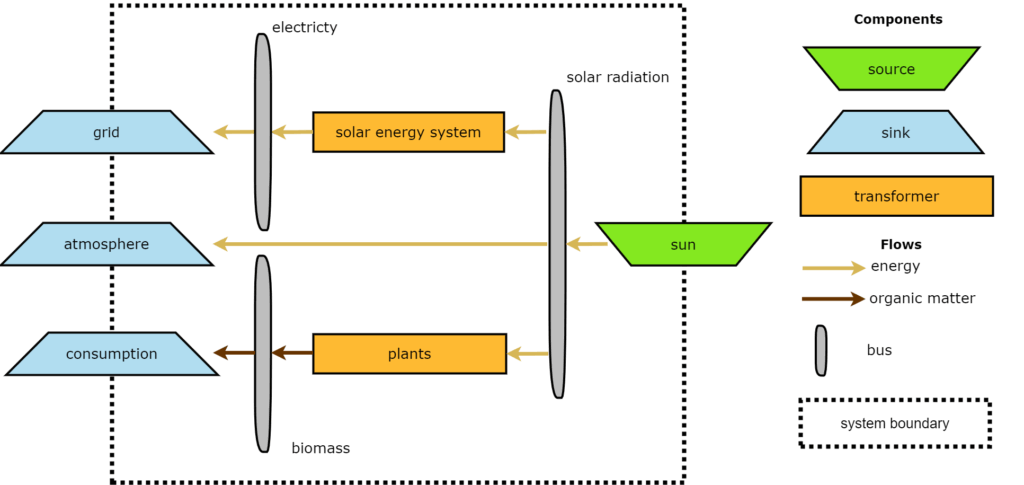
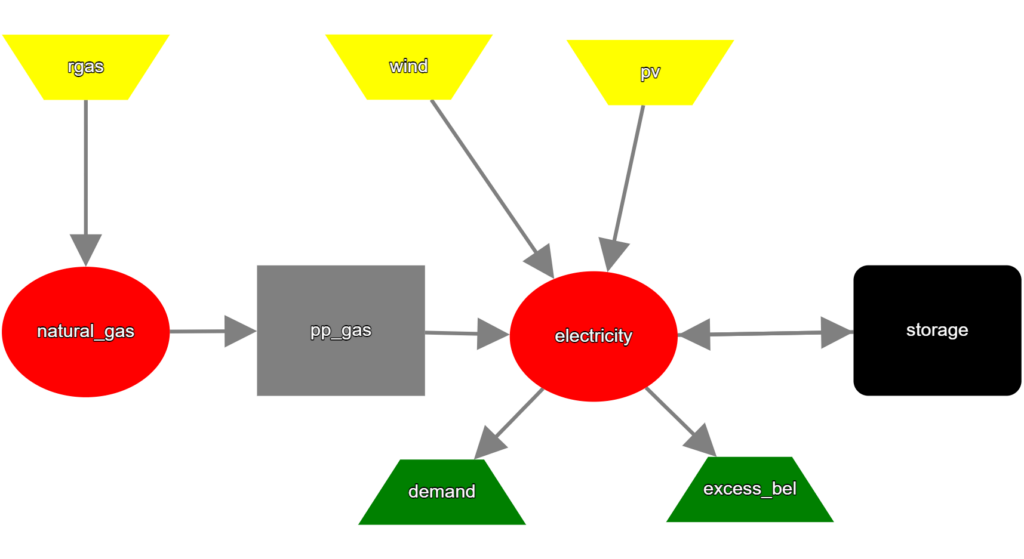
The model is implemented with oemof-solph as a cost-minimising linear optimisation. The energy system is represented in oemof’s graph structure which uses buses for carriers and components connected by flows. Electricity and hydrogen each have dedicated buses. Supply components include gas turbines and diesel sets alongside solar PV, onshore wind, hydropower and biomass. The hydrogen chain is modelled with standard solph components: an electrolyser transformer converts surplus electricity to hydrogen, a hydrogen storage component holds the gas, and a fuel-cell transformer reconverts it to electricity when needed. Batteries provide a parallel short-term storage route. Demand, exports and curtailment are represented as sinks. Figures in the paper show the reference energy system and a simplified green-hydrogen chain built exactly this way.

Continue reading “Exploring the role of green hydrogen for distributed energy access planning towards net-zero emissions in Nigeria”

OWEFE: integrated water, energy, food, and environment systems

As developers and users of the oemof software, we’re always interested in efforts that leverage its modular, open-source design for broader, cross-sectoral analyses. A recent paper, OWEFE, open modelling framework for integrated water, energy, food, and environment systems by J. Fleischmann et al. (2024), presents an “integrated-WEFE” layer that extends oemof’s energy system graph to encompass water, energy, food, and environmental systems in one unified model.

Continue reading “OWEFE: integrated water, energy, food, and environment systems”

Interactive solph graph using Dash

Modelling energy systems as graphs, as we do it for oemof, is a rather clear approach. It can help understanding energy flows and the overall network structure. However, in highly complex systems keeping of all the components track becomes increasingly difficult. To tackle this, Tobias Hörter and Andreas Wunsch from Fraunhofer IOSB have created an interactive plotting tool.

The example can be found as a Snippet at the Faunhofer GitLab. The code enables visualization of the system and representation of the component’s parameters upon the model-creation.  They use a combination of NetworkX and Plotly DASH Cytoscape for this purpose. The parameters of the model components are first extracted and a NetworkX model is created from the solph energy system afterwards. This network is then used to make cytoscape elements, which are necessary to enable DASH-Plotly to visualize the network.

When running the Dash-App, the user can rearrange the system via drag and drop. Additionally, when clicking on the system components, the parameters of the respective component are displayed. Do you like this approach? How do you draw the energy system graph if you need it?